In February 2017, a nutritional plan was implemented with nutrient solutions corrected by the in situ sap analysis method, incorporating BIOFEED ACT (amino carbon technology) technology, which improves the efficiency of nutrient solutions, in a sector of nectarine variety carmina 6, from a farm in Cieza (Murcia), owned by a company of relevance in the horticultural sector, compared to a sector of the same variety nourished in a professional manner with other fertilizers, hereinafter STD (standard) . For this test it is decided to develop nutrient solutions with simple crystalline fertilizers, which are corrected according to the interpretation of the monitoring data.
Goal:
To provide the most efficient solution, applying just what the crop needs at every moment, applying precision agriculture.
In order to do this, we will use a new methodology of sap monitoring in real-time, associated to the ultraefficient liquid fertilizers of Biofeed. This type of analysis allows us to make changes in real time according to the values obtained in sap, anticipating to potential deficiencies, contributing those ions that are needed and reducing those in excess.
Through this system we achieve:
- Obtain real-time data on nutrient uptake and their mobility by the plant.
- Quick adjustment of fertilization, with the help of additional irrigation and soil information.
- The design of an optimized nutritional plan, minimizing the use of salts and chlorides.
- The restoration of the physical-chemical properties of the soil.
- Increase assimilation and mobility of nutrients in soil and plant.
- We reduce the energy use of the plant through ultra-efficient nutrition.
Results:
Next we will comment on the graphs of the results obtained with the monitoring in the analyzed parameters.
Graph No. 1:
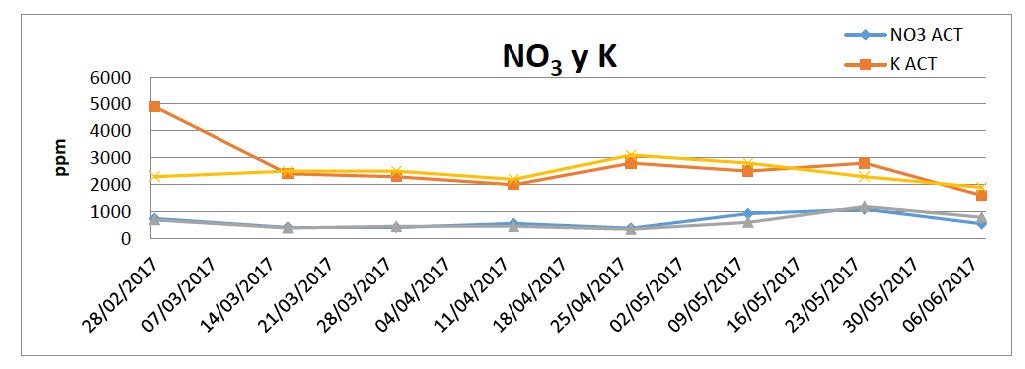
We can see that, despite having 2 different fertilization plans, the changes in the ion-to-sap rates show little
variation. So, the phenological rate is considered, which is the value of [K] + / [NO3] (being 1 super vegetative,
and super 8 generative).
Graph No. 2:
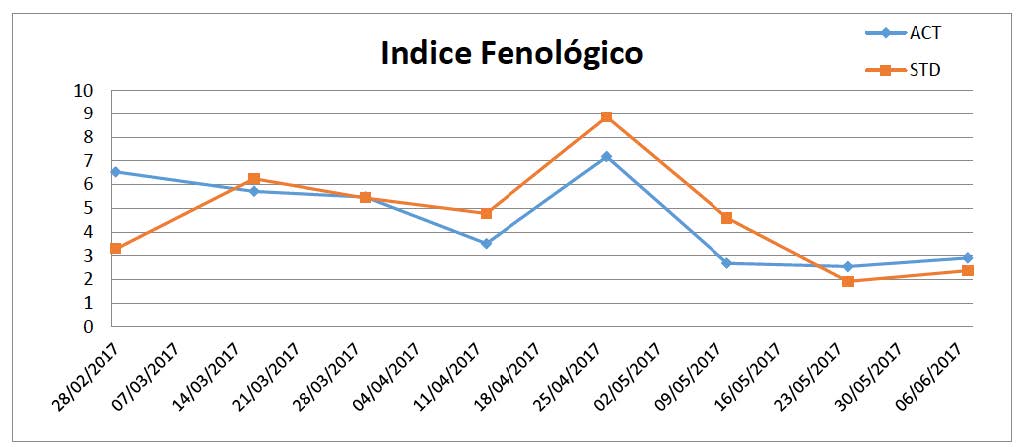
In figure 2 it is seen how, although the trend lines are similar, the leaps and extremes are greater for the STD sector, with less stress or sudden changes in the ACT sector, even being <8 at times of fattening and maturation in STD, indicating great stress. Coinciding with the moments of greatest need of K in the plant.
Graph No. 3:
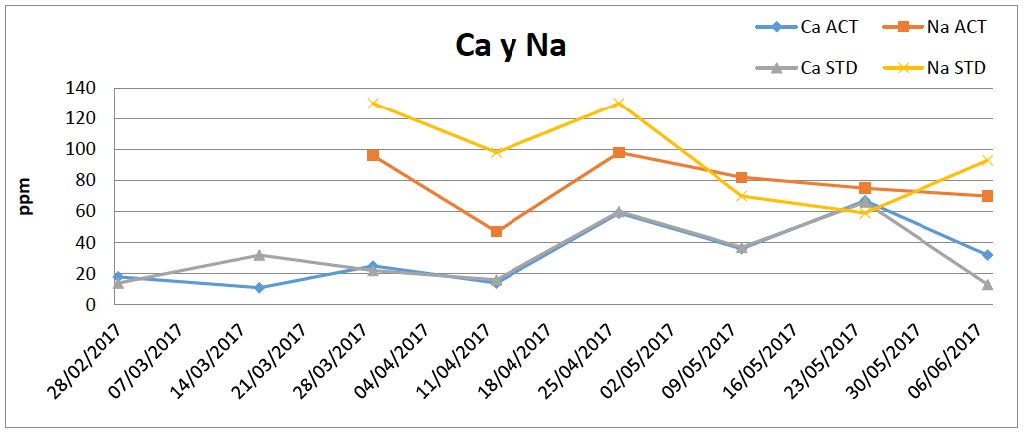
It is very significant as in this graph the levels of ionic Ca are similar in both cases throughout the cultivation, but in the final stage it increases from 13 ppm in STD to 32 ppm in ACT which is 146% more ionic calcium in this stage.
When analyzing Na we see a lower content in sap the whole cycle, including the final stage. Hence, given the same Ca content, this is more efficient in ACT as it contains less Na.
Graph No. 4:
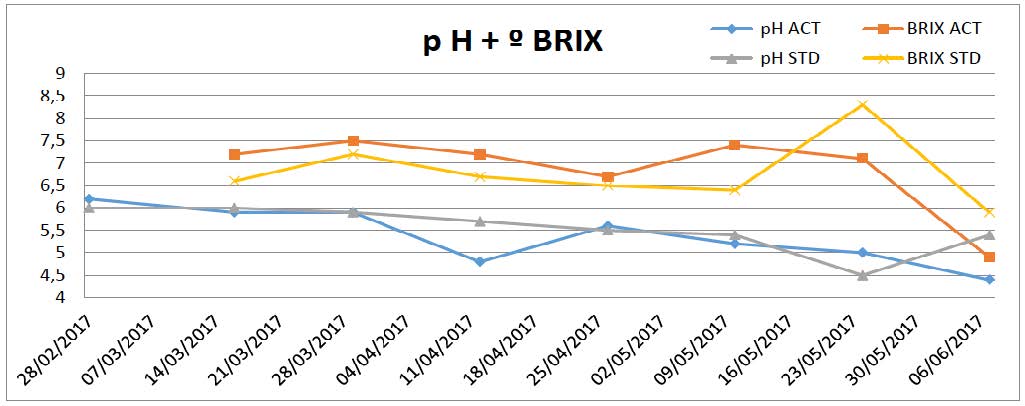
The Brix tells us that the ACT plant has worked more and better throughout the cycle than STD, less in the final phase of pre-harvest, but in view of the results it can be interpreted that the crop has reached a physiological maturity at the same time that the fruit for which it has initiated a natural withering, which can result in a better quality of fruits.
The pH is decreasing during a crop cycle, which indicates the high potash requirement of this crop.
PRODUCTIVITY:
Nectarine, Carmina 6 STD = 38216 Kg/ha
Nectarine, Carmina 6 ACT = 39640 Kg/ha
The good analytical data during the follow-up coincides with an increase in production of an additional 3.7% in the plots fed with BIOFEED.
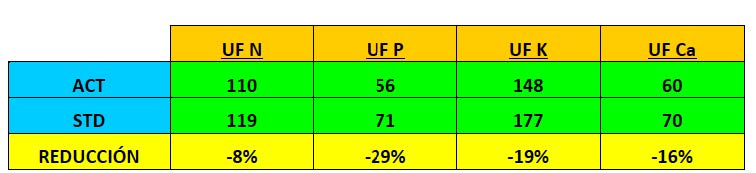
FERTILIZATION:
In the demonstration plot, the nutrient solution was modified according to real-time analytical needs in the field, and the fertilizer consumption was the following in both plots.
Next, the Kg / Ha of pure fertilizer supplied in both plots. As shown, in the plot treated with ACT there has been a lower need for fertilizer and a cost saving.
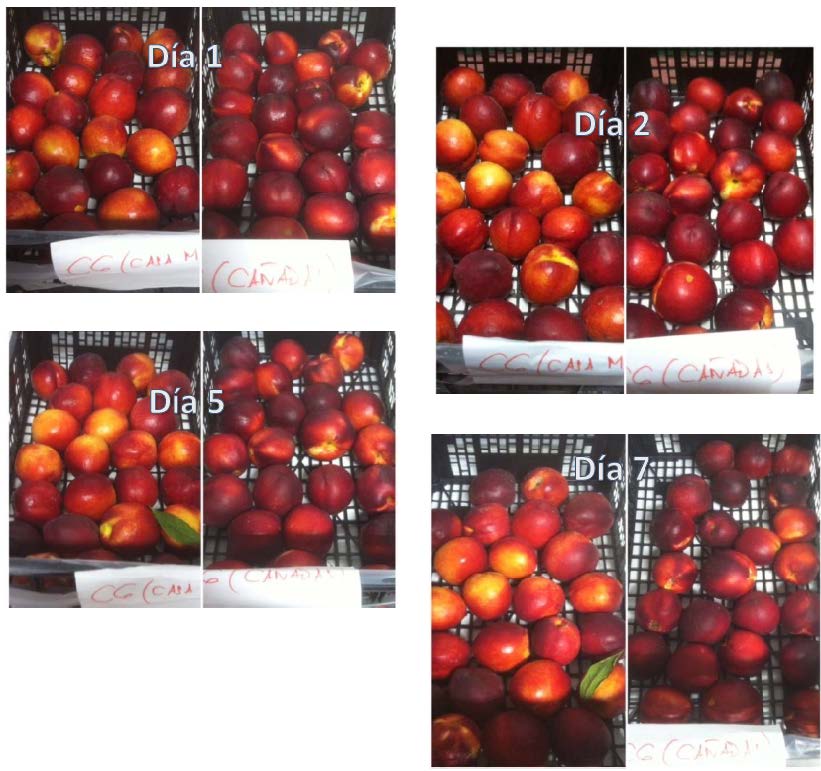
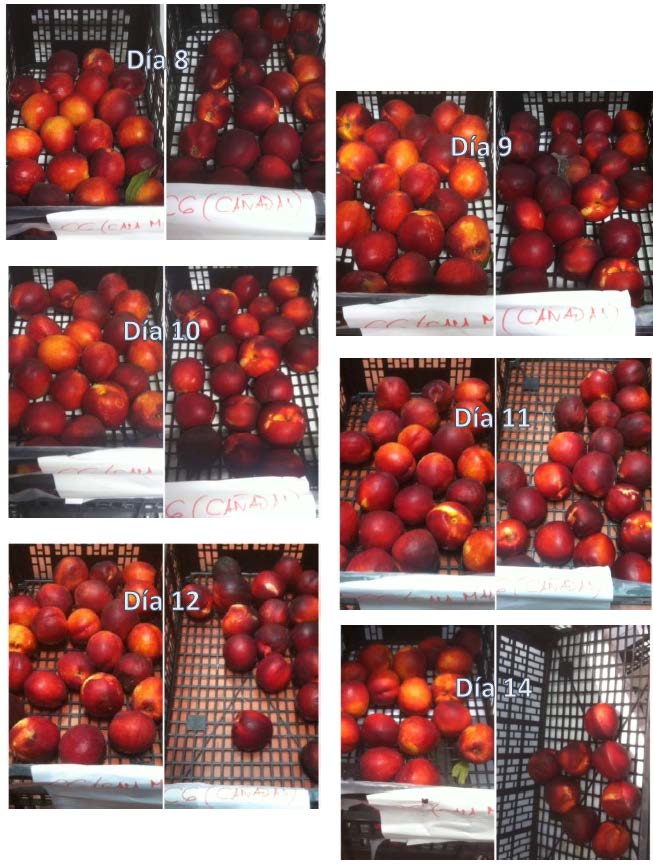
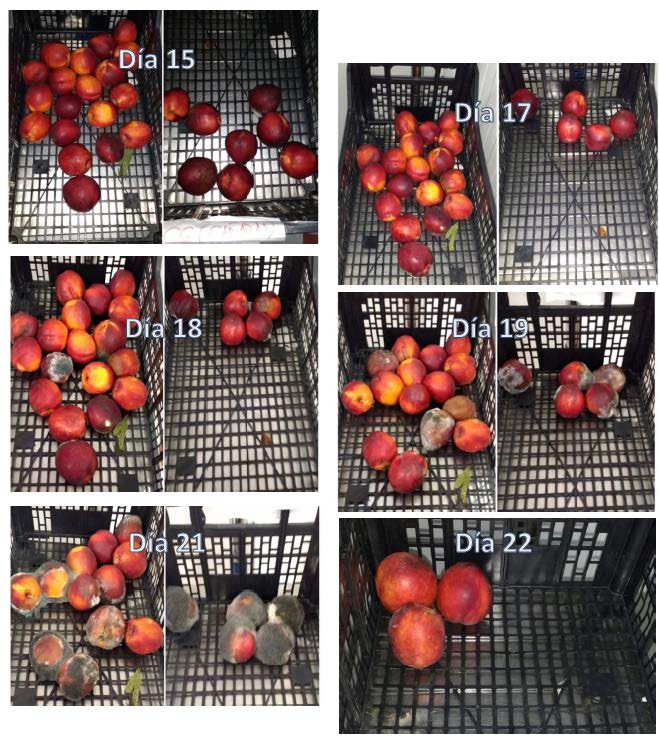
A fruit box from each plot is prepared with 24 commercial-quality fruits and the same initial box weight. Variety Carmina 6, a plot carried with CHETROL of BIOFEED that gives us the ACT and the other with the standard handling.
They are stored indoors at room temperature. Pictures are taken, the boxes are weighed daily and the rotten fruits are removed.
THE FOLLOWING CHART SHOWS THE DATA OBTAINED IN THE FOLLOW-UP OF CONSERVATION
Graph No. 5:
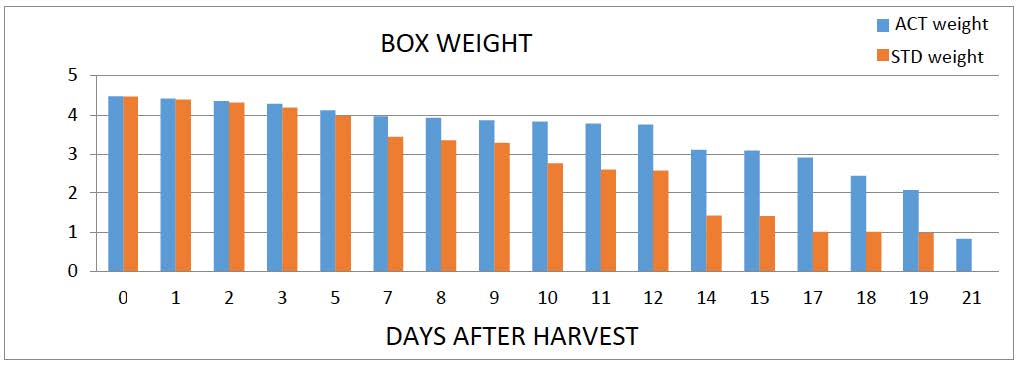
The graph shows how the weight of the fruits cultivated with ACT is more stable and is better maintained, taking more time to lose water. In other words, they have a higher content in dry matter than the standard, so they present better quality and conservation. This fact is better demonstrated in the next graph, which shows the number of pieces of each box which begin to rot and are removed. In this case treated fruits are more resistant to natural rotting, indicating that at equal weight there is a better internal structure of fruit and a more efficient transformation of dry matter.
Graph No. 6:
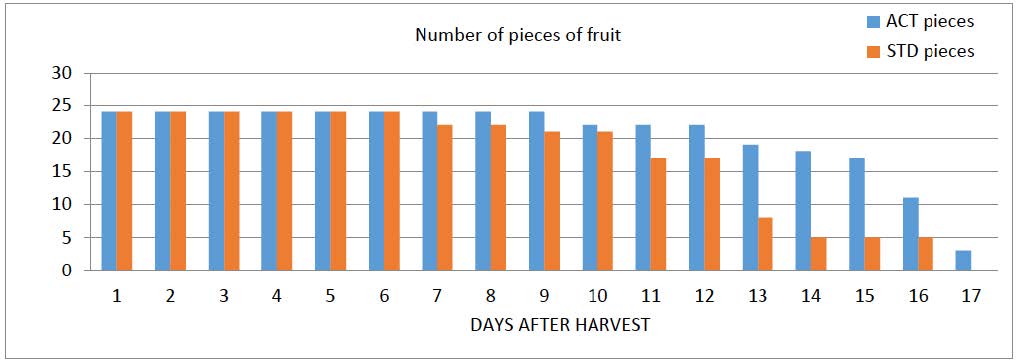
IMPORTANT IMPROVEMENT OF QUALITY, CONSERVATION AND LIFE
Below is the sequence of photographs of the boxes studied from each plot, to see directly what the graphs and data indicate.
In the sequence of photos, to the left those treated with ACT, to the right the standard handling.